# Charts
**Charts** in ONEWEB Page Designer allow developers to visualize data using graphical representations such as bar charts, line charts, and other chart types.\
Page Designer uses the **ChartJS extension** to provide flexible and interactive charting capabilities for web and mobile applications.
Charts are commonly used for:
* Dashboards
* Reports and analytics
* Monitoring KPIs
* Visualizing real‑time or historical data
Charts can be populated using:
* **Static data**
* **Dynamic data from Microflows**
***
### Enable ChartJS Extension
Before creating charts, the **ChartJS extension** must be added and enabled in the application.
#### Step 1: Open Extensions in Resources
1. Open **Page Designer**
2. Go to the **RESOURCES** tab
3. Open the **Extensions** sub‑tab
4. Click **Add more extension**
***
#### Step 2: Install ChartJS Extension
1. Drag & Drop the **PGDChart (ChartJS)** extension file\
**or**
2. Browse and select the extension file
3. Click **Install**
4. Close the extension window
***
#### Step 3: Verify Extension Status
Ensure the ChartJS extension is **added and enabled** for your application.
***
### Create a Chart on a Page
#### Step 4: Add Chart Component
1. Open the page where you want to display the chart
2. From the **CHART** panel, drag and drop a **Chart** component onto the page
***
#### Step 5: Configure Chart Properties
1. Select the Chart component
2. Open the **Chart Properties** tab
3. Set chart attributes such as:
* Chart type
* Labels
* Axis settings
* Appearance options
***
### Configure Chart Data
Charts support both **static** and **dynamic** data.
***
#### Option 1: Edit Static Chart Data
1. Click **Edit Chart Data**\
**or**
2. Click the **Edit Data icon** on the design panel
***
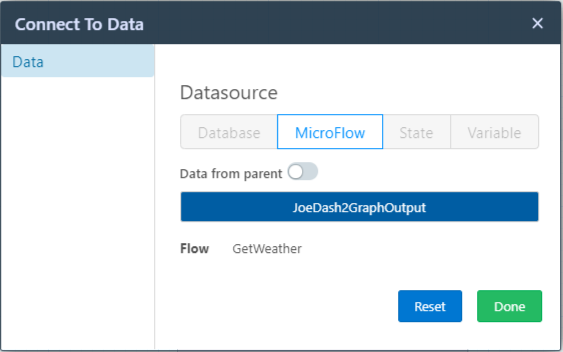
#### Option 2: Bind Chart to Microflow Data
Charts can dynamically display data returned from **Microflows**.
1. Click the **Connect to Data** icon
2. Bind the chart to a Microflow output
***
### Build and View Chart Output
1. Save the page
2. Build the application
3. Preview the page to see **real‑time chart data** from the Microflow output
***
### Design Perspective
As part of **Page Designer best practices**:
* Use charts to communicate insights, not raw data
* Choose the appropriate chart type for the data
* Keep labels and legends readable
* Avoid overloading charts with too many data points
* Use Microflows for real‑time or aggregated data
Charts enable ONEWEB applications to present **clear, visual, and actionable data insights**.
---
# Agent Instructions: Querying This Documentation
If you need additional information that is not directly available in this page, you can query the documentation dynamically by asking a question.
Perform an HTTP GET request on the current page URL with the `ask` query parameter:
```
GET https://docs.onewebstack.com/building-apps/ui-page-designer/ux-ui-components/pages/page-features/charts.md?ask=
```
The question should be specific, self-contained, and written in natural language.
The response will contain a direct answer to the question and relevant excerpts and sources from the documentation.
Use this mechanism when the answer is not explicitly present in the current page, you need clarification or additional context, or you want to retrieve related documentation sections.