# Edit Chart Series
After configuring a chart series, you can **modify the series definition** to change how data is grouped, filtered, or displayed on the chart.\
Editing a chart series is done by **updating existing records** in the database table **`DASH_WIDGET_CHART_PROP`**.
This allows you to adjust the *angle of analysis* without creating a new chart or widget.
***
#### Update Chart Series Configuration
To edit an existing chart series, update the corresponding record in **`DASH_WIDGET_CHART_PROP`**.\
The example below highlights the fields that were modified (shown in **orange** in the original configuration) to change how the chart data is represented.
***
#### Updated DASH\_WIDGET\_CHART\_PROP Values
| Column | Value |
| ----------------- | ------------- |
| ID | `9010101` |
| DASH\_ID | `90101` |
| CHART\_TYPE | `line` |
| TABLE\_NAME | `MOCKUP_DATA` |
| FIELD\_NAME | `COL2_VALUE` |
| FIELD\_DESC | `COL1_DESC` |
| COND1\_FIELD | `DASH_CODE` |
| COND1\_VALUE | `SA004-1` |
| SEQ | `1` |
| NAME | `BANGKOK` |
| STACK\_GROUP | *(empty)* |
| COND2\_FIELD | `COL2_DESC` |
| COND2\_VALUE | `BANGKOK` |
| FIELD\_DESC\_SORT | *(empty)* |
| FIELD\_PREFIX | *(empty)* |
| FIELD\_SUFFIX | *(empty)* |
| SYMBOL | *(empty)* |
| LEGEND | *(empty)* |
| FIELD\_COLOR | *(empty)* |
| DATA\_LABEL | *(empty)* |
| Y\_AXIS | *(empty)* |
> The highlighted changes adjust how the chart groups and filters data, shifting the comparison logic used by the series.
***
#### Purpose of the Changes
By modifying the following fields:
* **FIELD\_DESC**
* **NAME**
* **COND2\_FIELD**
* **COND2\_VALUE**
the chart series is reconfigured to focus on a **specific province (Bangkok)** and display results across **multiple quarters**, rather than comparing provinces within a single quarter.
This demonstrates how the same dataset can be analyzed from different perspectives by adjusting series configuration.
***
#### Verify the Updated Chart
After saving the updated configuration:
1. Open the dashboard page again.
2. Click the **Training** page menu.
The chart should now render the updated series configuration.
***
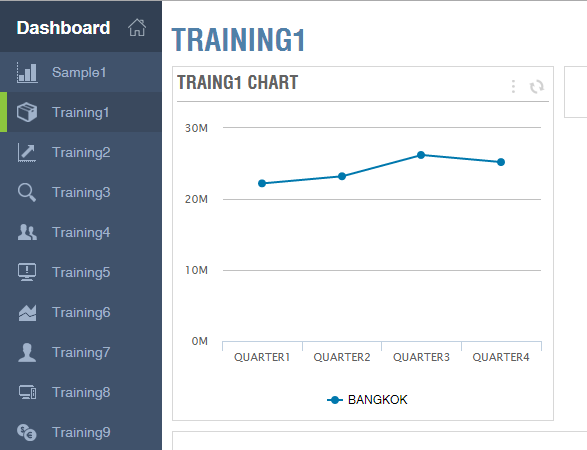
#### Expected Result
The chart now represents **Income of Bangkok**, compared **across each quarter**, as shown in the example below.
***
#### Summary
Editing chart series by updating the `DASH_WIDGET_CHART_PROP` table allows you to:
* Reuse existing widgets
* Change comparison dimensions
* Customize analytical views without rebuilding dashboards
This flexibility makes the Widget Dashboard a powerful, configuration‑driven reporting solution within ONEWEB.
---
# Agent Instructions: Querying This Documentation
If you need additional information that is not directly available in this page, you can query the documentation dynamically by asking a question.
Perform an HTTP GET request on the current page URL with the `ask` query parameter:
```
GET https://docs.onewebstack.com/building-apps/ui-page-designer/ux-ui-components/dashboard/widget-dashboard/steps-to-create-a-widget-dashboard/edit-chart-series.md?ask=
```
The question should be specific, self-contained, and written in natural language.
The response will contain a direct answer to the question and relevant excerpts and sources from the documentation.
Use this mechanism when the answer is not explicitly present in the current page, you need clarification or additional context, or you want to retrieve related documentation sections.